Advisor details
Percona advisors provide automated insights and recommendations within Percona Monitoring and Management (PMM). These proactive insights help you uncover problems before they become larger issues: security risks, misconfigurations, poor performance, etc.
Advisors are grouped by category: Security, Configuration, Performance and Query. Each advisor category offers a set of automated checks, which investigate a specific range of possible issues.
Enable/Disable
Advisors are bundled with every PMM installation and automatically loaded by PMM Server when starting up. PMM runs automatic advisor checks in the background when the Advisors option is enabled under Configuration > Settings > Advanced Settings. This option is enabled by default, but you can disable it at any time if you do not need to check the health and performance of your connected databases.
Automatic checks
Advisor checks can be executed manually or automatically. By default, PMM runs all the checks available for your PMM instances every 24 hours.
Check results always remain on the PMM Server. They are never sent as part of Telemetry.
Configure execution intervals
To control when and how often advisor checks run:
- for all checks: Navigate to PMM Configuration > Settings > Execution Intervals to set global default intervals.
- for individual checks: Navigate to the specific advisor category (such as Advisors > Security Advisors, Configuration Advisors, Query Advisors, or Performance Advisors), then click the Edit icon in the Actions column to override the global setting for specific checks.
Change run interval for automatic advisors
You can change the standard 24-hour interval to a custom frequency for each advisor check:
- Rare interval - 78 hours
- Standard interval (default) - 24 hours
- Frequent interval - 4 hours
To change the frequency of an automatic check:
- Click Advisors.
- Select the Advisor tab that contains the check for which you want to change the frequency.
-
Expand the relevant advisor and scroll through the list to find your check. Alternatively, use the Filter section at the top of the table to search checks by Name, Description, Status, or Interval.
Tip
If you need to share filtered advisor results with your team members, send them the PMM URL. This saves your search criteria and results.
- Click the Interval icon in the Actions column, next to the check you want to update.
- Chose an interval and click Save.
Manual checks
In addition to the automatic checks that run every 24 hours, you can also run checks manually, for ad-hoc assessments of your database health and performance.
To run checks manually:
- Click Advisors on the main menu.
- Select the Advisor tab that contains the checks which you want to run manually.
-
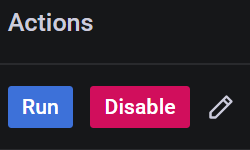
Click Run checks to run all available checks for this advisor group, or expand an advisor and click Run next to each check you want to run individually:

Advisor results
The results are sent to PMM Server where you can review any failed checks on the Home dashboard. The summary count of failed checks is classified as:
- Critical, which also includes checks tagged as Alert and Emergency
- Error
- Warning
- Notice, which also includes checks tagged as Info and Debug

To see more details about the available checks and any checks that failed, click the Advisors icon on the main menu.
Create your own advisors
Advisors detect common security threats, performance degradation, data loss and data corruption. If you are a developer, you can create custom checks to cover additional use cases, relevant to specific database infrastructure.
For more information, see Develop Advisor checks.